Why hotel carbon footprint numbers rarely match and why it matters
Every hotel team now publishes a carbon footprint somewhere, yet the numbers for similar hotels often diverge wildly. When the same property shows different carbon emissions in two consultant reports, the problem usually sits in the underlying data and the conversion factors, not in the narrative. For general managers, ESG leaders and asset managers, understanding how to calculate a hotel carbon footprint with discipline is now a governance issue, not a marketing choice.
The hospitality industry contributes significantly to global carbon through energy use, refrigerants, waste and water, and average hotel stays generate around 35 kilograms of CO₂ per room night across segments, based on ranges reported in the Hotel Carbon Measurement Initiative (HCMI) technical guidance (version 2.0, 2016, section 4) and the Cornell Hotel Sustainability Benchmarking (CHSB) study (for example CHSB2023, tables 3–5). Luxury hotels can reach 60 kilograms of CO₂ per room night or more, which means that a portfolio of upscale hotels can carry a total environmental impact that rivals small industrial sites. In this context, hotel sustainability strategies that ignore rigorous carbon measurement and sustainability reporting are no longer credible for investors or regulators.
Hotel operators, owners and brands face pressure from environmental organizations, public institutions and the hospitality alliance of trade bodies to align on a common measurement initiative. The Hotel Carbon Measurement Initiative, usually shortened to HCMI, and the Hotel Water Measurement Initiative, or HWMI, were created as an industry standard to calculate the carbon footprint and carbon water footprint of hotels per room night and per square metre. Used correctly, HCMI and HWMI convert raw energy and water consumption data into comparable carbon footprint metrics that can feed sustainability benchmarking, sustainability reporting and investor grade disclosures, as set out in the latest HCMI methodology (v2.0, annexes A–C) and HWMI guidance (v1.0, methodology sections).
Where the activity data lives: building a defensible carbon inventory
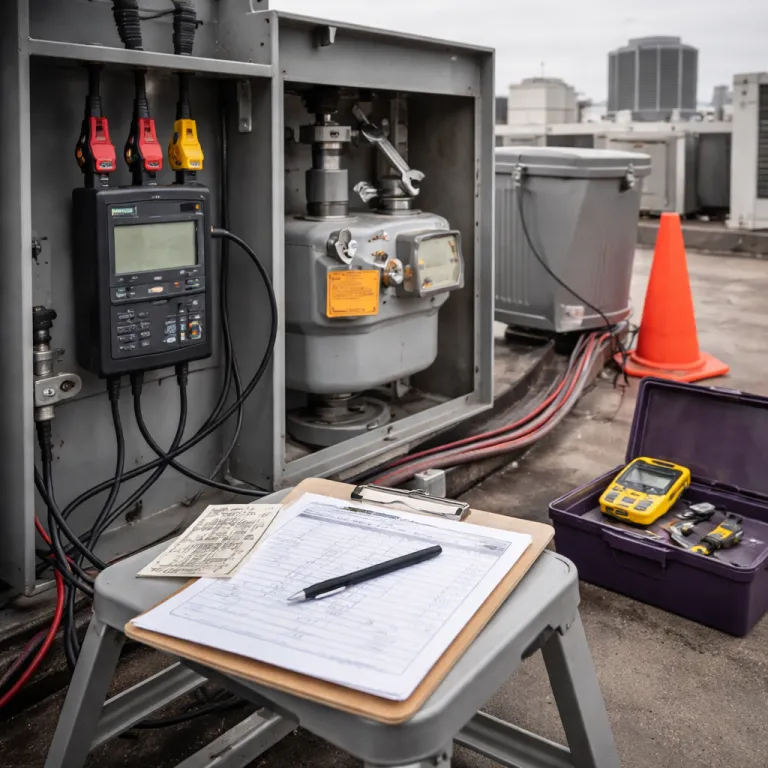
Reliable hotel carbon footprint work starts with a complete activity data map, not with a glossy dashboard. Scope 1 emissions in a single hotel usually come from natural gas or fuel oil for boilers, kitchen combustion, emergency generators, refrigerant leakage and any owned fleet vehicles. For multi asset hotel portfolios, these Scope 1 factors must be collected property by property, with clear documentation of meter locations, fuel types and any changes in equipment that affect total consumption.
Scope 2 emissions cover purchased electricity and sometimes district heating or cooling, and here the distinction between location based and market based carbon measurement is critical. Location based carbon emissions use grid average conversion factors, while market based emissions reflect specific renewable energy contracts, guarantees of origin or power purchase agreements that can genuinely decarbonise the electricity used by hotels. A hotel that claims low carbon footprint performance based on unbundled certificates without physical renewable energy supply will face scrutiny from auditors and responsible investors, especially where factor choices deviate from sources such as IEA country grid factors, national greenhouse gas inventories or the UK Government GHG Conversion Factors for Company Reporting.
Scope 3 is where most of the environmental impact of the hotel industry hides, and where data gaps are largest. Priority categories for hotels include purchased goods and services, capital goods, waste, business travel, employee commuting and guest travel linked to hotel stays, plus downstream leased assets for asset light models. Ethical decision making in tourism and hospitality, including how to attribute travel related emissions to hotel carbon accounts, is explored in depth in this analysis of responsible and sustainable practices in hospitality.
A practical activity data checklist for hotels typically covers: fuel consumption by type (gas, oil, LPG), purchased electricity and heat, refrigerant top ups by gas, water abstraction and discharge volumes, waste by stream and treatment route, food and beverage purchasing, textiles and amenities, business travel records, employee commuting surveys and guest transport assumptions. Common proxies include spend based estimates for purchased goods and services, average waste generation per guest night where scales are absent, modelled refrigerant leakage rates where maintenance logs are incomplete and typical travel distances per guest segment when detailed origin data is unavailable.
Choosing emission factors and tools: HCMI, HWMI and the footprinting stack
Once activity data is under control, the next source of divergence in hotel carbon footprint results is the choice of emission factors and footprinting tool. Consultants may use DEFRA, EPA, IEA or Ecoinvent databases, while the hotel industry has its own measurement initiative through the HCMI and HWMI methodologies. The HCMI tool and the HWMI guidance were developed with the hospitality alliance of major brands and the Cornell Hotel Sustainability Benchmarking program to reflect hotel specific operating patterns.
For hotel operators, the priority is not to chase the perfect factor but to document which conversion factors are used, why they were selected and how often they are updated. A robust footprinting tool for hotels should allow users to calculate carbon emissions and carbon water impacts per room night, per occupied room and per square metre, while also aggregating to total portfolio level for sustainability reporting. When a hotel changes from one carbon measurement database to another, the change in factors must be disclosed so that year on year trends in carbon footprint remain interpretable and can be reconciled with sources such as the UK Government GHG Conversion Factors for Company Reporting, IEA grid intensity tables or comparable national datasets.
To illustrate how factor selection changes results, consider a hotel that consumes 1 000 000 kWh of electricity in a year. Using a location based grid factor of 0.30 kg CO₂e per kWh (roughly aligned with lower carbon grids in recent DEFRA and IEA tables), the annual emissions are 300 000 kg CO₂e. If a consultant instead applies a factor of 0.45 kg CO₂e per kWh (more typical of carbon intensive grids in some national inventories), the same 1 000 000 kWh produces 450 000 kg CO₂e. The activity data is identical, but the reported hotel carbon footprint differs by 50 %, which is why transparent citation of factor tables and versions is essential.
Technology leaders in hotels should aim for a minimum stack that combines an energy management system, a utility data platform and a specialist HCMI tool or module that automates calculations. This stack should integrate with property management systems to align room night counts with energy and water consumption, and it should support renewable energy tracking where on site solar or green power contracts exist. For food and beverage operations, innovative strategies for sustainable food systems in hospitality, such as those analysed in this article on sustainable food systems in hotels, can materially shift Scope 3 emissions and should be reflected in the footprinting tool.
Normalising hotel carbon data: from raw kilowatt hours to investor ready KPIs
Raw energy consumption and water use tell engineers how a plant is running, but investors and auditors need normalised hotel carbon footprint indicators. The most common intensity metrics in hotel sustainability reporting are kilograms of CO₂ per room night, per occupied room, per square metre of gross floor area and per unit of revenue. Each metric answers a different question, and choosing the wrong denominator can hide or exaggerate the environmental impact of hotels.
Per room night or per occupied room metrics are useful to compare hotels with similar service levels, while per square metre intensity helps asset managers benchmark building performance across mixed use portfolios. Revenue based carbon footprint intensity is increasingly used by investors who want to understand how efficiently hotels convert carbon emissions into economic value, especially when comparing hotels to other real estate or service sectors. Energy per occupied room, sometimes called ECOR, and carbon intensity per square metre are now standard KPIs in sustainability benchmarking frameworks used by lenders and rating agencies, including those that draw on CHSB data for peer comparisons.
For hotel technology leaders, the challenge is to ensure that the same underlying data feeds all these views without manual rework. That means aligning room night definitions across revenue management, finance and ESG teams, and ensuring that the HCMI HWMI calculations are embedded in the reporting tool rather than in offline spreadsheets. Marriott, for example, tracks a targeted reduction in carbon intensity using energy management system data, illustrating how integrated data and clear KPIs can turn carbon measurement into operational discipline.
Red flags in consultant reports and how to challenge them
When a consultant presents a glossy hotel carbon footprint report, senior leaders should read it with the same scepticism they apply to financial statements. Unexplained year on year drops in total carbon emissions, especially when energy consumption and occupancy are stable, usually signal a change in conversion factors or system boundaries that has not been disclosed. Missing categories in Scope 3, such as capital goods or guest travel linked to hotel stays, can understate the environmental impact of hotels by a wide margin.
Proxy overreach is another common issue, where consultants use generic industry averages instead of hotel specific data because metering or procurement records are incomplete. While some proxy use is inevitable, especially for upstream supply chains, a mature hotel sustainability program will progressively replace proxies with measured data and will flag remaining estimates transparently in sustainability reporting. When two consultants produce very different carbon footprint numbers for the same hotel, the first questions should be about activity data sources, emission factors, HCMI or non HCMI methodologies and the treatment of renewable energy contracts.
Compliance leaders should also watch for inconsistent use of the HCMI tool and HWMI guidance, where some hotels in a group apply the hotel carbon methodology rigorously while others rely on simplified templates. A credible measurement initiative inside a hotel group requires central governance, clear documentation and periodic internal audits of carbon measurement processes. As one industry FAQ reminds us, “What is the average carbon footprint of a hotel stay? Approximately 35 kg CO₂ per night.” and “Do luxury hotels have higher carbon footprints? Yes, luxury hotels can emit up to 60–90 kg CO₂ per night.”, figures that are broadly consistent with HCMI based benchmarks (HCMI v2.0 worked examples) and CHSB ranges (for example CHSB2023, exhibit 6) and that underline how quickly numbers can escalate when assumptions shift.
Building an in house measurement capability: tech stack, governance and procurement
For mid size hotel groups, relying entirely on external consultants for hotel carbon footprint work is becoming both costly and risky. A minimum viable in house stack usually includes an energy management system, a utility bill and meter data platform, a central sustainability reporting tool with HCMI HWMI modules and a document repository for emission factor references. This stack should allow hotel teams to calculate carbon emissions, water impacts and total environmental impact per hotel and per portfolio, using consistent conversion factors and methodologies.
Governance is as important as technology, and hotel operators should define clear roles for ESG teams, finance, engineering and IT in the carbon measurement process. Data owners for energy, water and waste must be identified at property level, while central teams maintain the footprinting tool, update emission factors and coordinate external assurance. Procurement leaders also play a critical role, because supplier contracts for energy, renewable energy certificates, food, textiles and amenities determine both actual carbon footprint and the quality of sustainability data available for reporting.
As packaging and product regulations tighten, hotel procurement strategies will need to align with broader ESG and compliance requirements that go beyond carbon. The Packaging and Packaging Waste Regulation, for example, will force hotels to renegotiate supplier terms, and this analysis of rewriting hotel supplier terms shows how environmental impact and legal risk intersect in contracts. For hotel industry leaders, the endgame is not just a lower carbon footprint but a sustainable operating model where carbon, water, waste and social factors are integrated into everyday decision making.
Key statistics on hotel carbon footprint and environmental impact
- Average emissions per hotel stay are around 35 kilograms of CO₂ per night, which means that a 200 room hotel operating at 70 % annual occupancy (about 51 100 room nights per year) can emit over 1 700 tonnes of CO₂ per year from guest rooms alone, based on industry data from HCMI aligned benchmarks (HCMI v2.0, example calculations) and the Cornell Hotel Sustainability Benchmarking study (for instance CHSB2023, midscale and upscale averages).
- Luxury hotels can reach 60 kilograms of CO₂ per room night or more, so a 300 room luxury property at 70 % occupancy (around 76 650 room nights annually) can easily exceed 4 500 tonnes of CO₂ per year if no energy efficiency or renewable energy measures are in place, according to sector benchmarks that draw on CHSB (e.g. CHSB2023, luxury segment tables) and brand level disclosures.
- Energy typically represents about 60 % of a hotel’s operational carbon footprint, which is why energy efficiency projects and renewable energy sourcing deliver the largest immediate reductions in carbon emissions for most hotels, as highlighted in HCMI guidance (v2.0, methodology notes) and multiple hotel sustainability reports that reference DEFRA and IEA emission factors.
- Water use and wastewater treatment can add several kilograms of CO₂ equivalent per room night, especially in regions with energy intensive desalination or pumping, which reinforces the value of HWMI based water measurement in hotel sustainability programs and in local life cycle assessments.
- Industry data shows that hotels adopting advanced energy management systems and sustainability certifications can reduce energy consumption by 20 to 30 %, which translates into proportional reductions in carbon footprint when combined with appropriate emission factors from sources such as DEFRA, IEA, Ecoinvent or comparable national databases.
FAQ about hotel carbon footprint and measurement
What is the average carbon footprint of a hotel stay ?
Across segments, the average carbon footprint of hotel stays is around 35 kilograms of CO₂ per room night, although actual values vary by region, energy mix and service level. Midscale hotels often sit below this average, while full service and luxury hotels tend to exceed it because of higher energy and water consumption. Using HCMI based calculations allows hotels to benchmark their own footprint against these industry ranges and to compare results with datasets such as the Cornell Hotel Sustainability Benchmarking study (for example CHSB2023, global averages by segment).
How can hotels reduce their carbon footprint most effectively ?
Hotels reduce their carbon footprint most effectively by cutting energy consumption through efficiency measures, optimising heating, ventilation and air conditioning systems and investing in renewable energy where feasible. Complementary actions include reducing hot water demand, improving building envelope performance and upgrading to efficient kitchen and laundry equipment. Over time, engaging suppliers on low carbon products and services also reduces Scope 3 emissions linked to hotel operations.
Do luxury hotels always have higher carbon emissions than budget hotels ?
Luxury hotels usually have higher carbon emissions per room night because they offer larger spaces, more amenities and more energy intensive services such as spas, pools and extensive food and beverage operations. Sector data indicates that luxury properties can emit 60 to 90 kilograms of CO₂ per room night, compared with around 28 kilograms for typical three star hotels, according to HCMI based benchmarks and CHSB ranges (for instance CHSB2023, segment specific intensity values). However, highly efficient luxury hotels with strong energy management and renewable energy sourcing can narrow this gap significantly.
Which tools should a hotel use to measure carbon and water impacts ?
Hotels should use a combination of energy management systems, utility data platforms and recognised methodologies such as the Hotel Carbon Measurement Initiative and the Hotel Water Measurement Initiative to measure carbon and water impacts. A dedicated footprinting tool or sustainability reporting platform that embeds HCMI HWMI calculations helps standardise results across properties and portfolios. This approach ensures that carbon measurement is consistent, auditable and aligned with hospitality industry best practice.
Why do different consultants report different carbon footprints for the same hotel ?
Different consultants often report different carbon footprints for the same hotel because they use different activity data sources, emission factor databases, system boundaries and normalisation metrics. Some may apply HCMI and HWMI strictly, while others rely on generic industry averages or outdated conversion factors, which can significantly change total emissions. Hotel leaders should always request clear documentation of data sources, factors and assumptions to interpret and compare consultant reports correctly, and should check that the factors used are traceable to recognised references such as DEFRA tables, IEA grid factors, Ecoinvent datasets or national greenhouse gas inventories.